normal distribution — n. Statistics a symmetrical distribution, represented on a graph by a BELL CURVE, in which the class with the highest frequency is at the center and the classes with the lowest frequency are at each end … English World dictionary
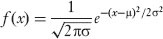
Normal distribution — This article is about the univariate normal distribution. For normally distributed vectors, see Multivariate normal distribution. Probability density function The red line is the standard normal distribution Cumulative distribution function … Wikipedia
normal distribution — Statistics. a theoretical frequency distribution represented by a normal curve. Also called Gaussian distribution. [1895 1900] * * * In statistics, a frequency distribution in the shape of the classic bell curve. It accurately represents most… … Universalium
normal distribution — Gaussian distribution The symmetrical bell shaped frequency curve formed when the frequency of a range of values is plotted on the vertical axis against the value of a random variable on the horizontal axis. The bell shape indicates that extreme… … Big dictionary of business and management
normal distribution — In common usage, normality is treated as synonymous with natural, conventional, acceptable, or ordinary. In statistics, normality is defined as the most commonly occurring, the numerically most frequent type, which is then used as the base line… … Dictionary of sociology
normal distribution — The well known bell shaped curve. According to the Central Limit Theorem, the probability density function of a large number of independent, identically distributed random numbers will approach the normal distribution. In the fractal family of… … Financial and business terms
normal distribution — normalusis skirstinys statusas T sritis fizika atitikmenys: angl. normal distribution; normal distribution law; normal law vok. Normalverteilung, f; Normalverteilungsgesetz, n rus. нормальное распределение, n; нормальный закон распределения, m… … Fizikos terminų žodynas
normal distribution — noun a theoretical distribution with finite mean and variance (Freq. 1) • Syn: ↑Gaussian distribution • Topics: ↑statistics • Hypernyms: ↑distribution, ↑statistical distribution * * * … Useful english dictionary
normal distribution — A *probability distribution model based on large *samples of items that cover a range of values in a *population. When plotted graphically, a normal distribution has a bell shaped curve that is symmetrical around the *mean. The *standard… … Auditor's dictionary
Normal Distribution — A probability distribution that plots all of its values in a symmetrical fashion and most of the results are situated around the probability s mean. Values are equally likely to plot either above or below the mean. Grouping takes place at values… … Investment dictionary
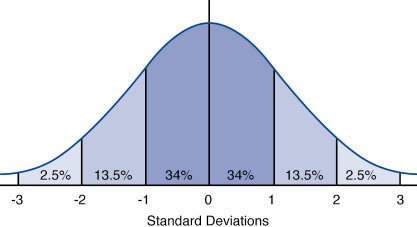
 Normal distribution. The approximate percentage of the area (or frequency) lying under the curve between standard deviations is indicated.